How to Rotate Data Labels in Excel Graph: 6 Best Ways
Are you wondering how to accommodate long axis and data labels in an Excel chart by rotating the angle of the text? You’ve reached the right resource!
Unlocking the power of data visualization is essential for effective communication in Excel. While graphs provide a visual representation of data, the positioning of data and axis labels improve readability and comprehension.
One crucial customization feature is the ability to rotate data and axis labels in an Excel graph. By rotating data labels, you can enhance clarity, emphasize key insights, and optimize the presentation of your chart.
In this tutorial, you’ll explore various methods to rotate data labels in Excel graphs. Let’s get started!
Why You Must Rotate Data Labels in Excel
- Rotating data labels can prevent overcrowding and overlapping. Further, making the chart and its data easier to read and interpret.
- By rotating specific data labels, you can draw attention to important or noteworthy data points, guiding the reader’s focus and emphasizing key insights.
- Rotating data labels is also useful when dealing with long label text that would otherwise exceed the available space. Rotating text allows you to utilize the vertical space and display the text without truncating it.
- Data and axis label rotation on an Excel graph also add a modern look to the content.
- In some cases, rotating data labels to match the orientation of the chart elements, such as bars or lines, can enhance the overall visual coherence and harmony of the graph.
So, now you know why you must rotate the axis and data labels in Excel when the text exceeds the horizontal space available for labeling. Now, find below some easy methods you can try:
Rotate Data Labels in Excel Using Format Axis
The Format Axis tool shall show up when you select the X-axis (horizontal axis) or Y-axis (vertical axis) and right-click. It provides various customization options on the right-side navigation panel on your worksheet.
One such customization is the Text Options menu. There, you’ll find various ways to change the angle or position of axis labels. Here are the steps you can try:
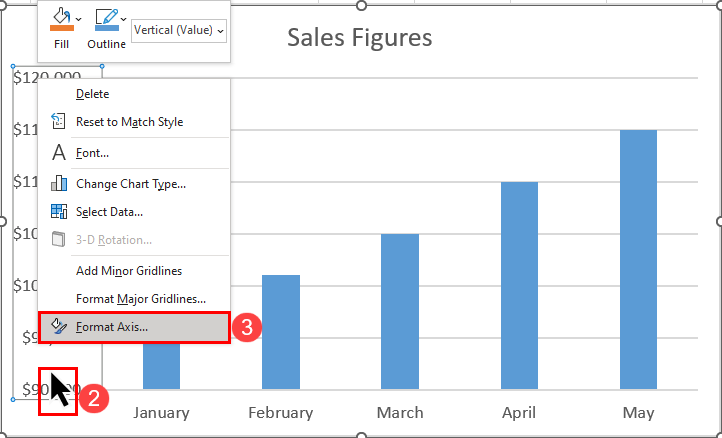
- Go to the chart on which you need to modify the axis label angle.
- Select and right-click on any of the axis labels.
- Click the Format Axis option on the context menu that shows up.

- Format Axis navigation panel should show up on the right side of the screen.
- Click Text Options.
- There, select the third option which is Textbox.
- Now, there are two options to rotate the texts and these are as below:
- Text direction: Horizontal, Rotate all text 90°, Rotate all text 270°, and Stacked.
- Custom angle: Enter any integer between 0 and 90, or -0 to -90.

That’s it! You’ll see the changes immediately on the Excel chart or graph you selected. This method will only work for the X-axis and Y-axis data labels on an Excel graph.
Note: The shortcut key to go directly to the Format Axis navigation panel after selecting the axis label is Ctrl + 1.
Rotate Data Labels Using Format Data Labels
Suppose you need to add the values of graph coordinates on the Series. Series are the elements that create the actual visualization on a graph by transforming the values of cells into graph coordinates. You can see them as columns in a bar chart, lines in a line chart, or scattered dots in a scatter chart.
If you already created a chart but don’t see the data labels on the Series, here’s how you can add data labels:

- Highlight the chart and click on the plus (+) or Chart elements icon.
- Click the Data Labels overflow menu arrow and choose a position for the Series data labels from the following options:
- Center
- Inside End
- Inside Base
- Outside End
- Data Callout
- Let’s choose Outside End in the current tutorial.
As you can see in the above example, the data label values show up horizontally. Since there is enough space for dollar figures, you can see the points easily.
However, if the dollar value increases, the data labels could overlap each other. You can see an example below:

In the above scenario, you must change the rotation angle of the data labels of the Series so the values show up clearly. Find below a step-by-step guide to fix the overlapping data labels:

- Click on any of the Series data labels and Excel will highlight all of them.
- Right-click and select the Format Data Labels option on the context menu you can see.

- The Format Data Labels navigation panel will show up.
- There, click Text Options.
- From the three text options choose the last one, that is, Textbox.
- Now, click the Text direction drop down list and choose Rotate all text 270°. The data label values will show up vertically.
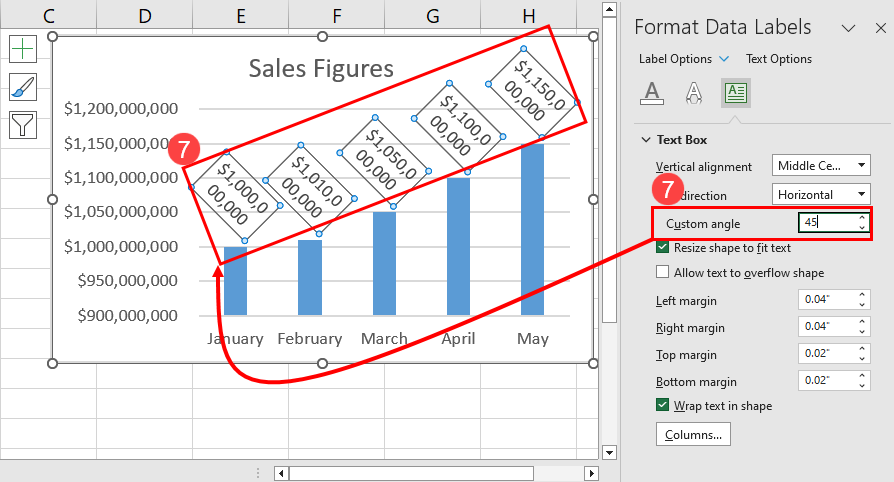
- Alternatively, you can enter any integer value between 0 to 90 in the Custom angle box. For example, 45.
Perfect! You’ve successfully rotated the data labels in an Excel graph.
Note: The shortcut key to go directly to the Format Data Labels navigation panel after selecting the data label is Ctrl + 1.
Change Text Direction or Angle From Format Chart Title
Your Excel chart could also contain chart titles and axis titles. If you need to rotate the text for these labels, follow these steps:

- Click the chart title on the graph.
- Right-click and choose the Format Chart Title option.

- On the Format Chart Title navigation panel, click Text Options.
- There should be three text options. Click on the last one, the Textbox.
- Now you can use either the Text direction option or the Custom angle box to rotate the text.
For axis titles on the X or Y axes, you can right-click on them and choose the Format Axis Title option and follow the steps mentioned above. This is how you can customize the text angle of the axis titles on an Excel graph.
Note: The shortcut key to go directly to the Format Chart Title navigation panel after selecting the chart label is Ctrl + 1.
Rotate Data labels in Excel Chart Using Orientation
This method is compatible with any selectable text or text boxes in an Excel graph. Here’s how you can try it on your own:
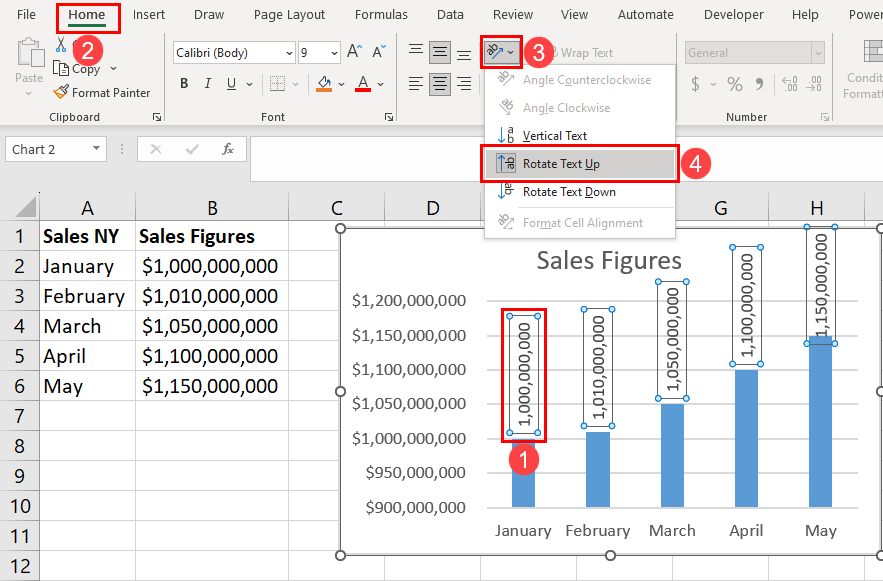
- Click any data label on the Excel graph to highlight all.
- Go to the Home tab on the Excel ribbon.
- On the Home tab, find and click the Orientation button inside the Alignment commands block.
- You can choose from any of the following options:
- Vertical Text
- Rotate Text Up
- Rotate Text Down
The above method is also applicable to Excel graph chart titles, axis titles, and axis labels.
Manually Rotating Data Labels in Excel Graph
In all the above methods, you can change the orientation or angle of the labels of the whole group, like all texts of Series data labels or axis labels. If you’re wondering how to use different text angles for different labels in an Excel graph, I’ve got a quick solution for you. Follow the steps outlined below:

- Select one data label on your chart.
- Excel will highlight all the labels automatically.
- Now, select the target data label again.
- This time, Excel will only highlight the selected data label.
- Now, go to Format Data Label > Text Options > Textbox.
- There, use the Custom angle box to enter a positive or negative angle between 0 to 90.
You should now see that only the selected data label has changed its orientation. You can follow this method also for axis labels on the X and Y axes.
How to Rotate Data Labels in an Excel Graph Using Excel VBA
Are you an Expert Excel user with ample knowledge of the Excel VBA program? Then you must love this method of automating the axis and data labels in an Excel chart.
Find below the code as well as the steps you need to try:

- Open the Excel VBA Editor interface by clicking the Developer tab and then Visual Basic inside the Code commands block on the Excel ribbon.

- On the Excel VBA Editor interface, click the Insert button and choose Module.
- Copy and paste the following VBA script inside the newly created blank module:
Sub ChangeTextAngle()
    Dim cht As ChartObject
    Dim xAxis As axis
    Dim yAxis As axis
    Dim series As series
    Dim dl As DataLabel

    ' Change the chart name as per your worksheet
    Set cht = ActiveSheet.ChartObjects("Chart 2")

    ' Change the angle for X-axis labels
    Set xAxis = cht.Chart.Axes(xlCategory)
    xAxis.TickLabels.Orientation = 20

    ' Change the angle for Y-axis labels
    Set yAxis = cht.Chart.Axes(xlValue)
    yAxis.TickLabels.Orientation = 0

    ' Change the angle for data labels
    For Each series In cht.Chart.SeriesCollection
        For Each dl In series.DataLabels
            dl.Orientation = 20
        Next dl
    Next series
End Sub
- Click the Save button and hit Yes on the warning message that pops up.
- Close the VBA Editor.

- Hit Alt + F8 to bring up the Macro dialog box.
- There, select the ChangeTextAngle macro and click Run.
Excel should automatically change the orientation of the text labels for Series data labels and Y-axis labels by positive 20°.
In the above VBA script, you must modify the chart name according to your own worksheet. Select the chart in question and look at the leftmost box of the Excel formula bar. There, you should find the chart name, like Chart 1, Chart 2, etc.

Once you know the chart name, modify the code element ActiveSheet.ChartObjects("Chart 2").
To change the text angles, modify the values for the following code elements using positive or negative integers of 0 to 90:
xAxis.TickLabels.Orientation = 20(for X-axis or horizontal axis)yAxis.TickLabels.Orientation = 0(for Y-axis or vertical axis)dl.Orientation = 20(for Series data labels)
Conclusion
By following the various methods outlined in this Excel tutorial article, you can easily customize the orientation of data labels to improve readability, highlight key insights, and accommodate lengthy text. This also enhances the overall aesthetics of your charts.
Whether you’re presenting data to colleagues, clients, or stakeholders, the ability to rotate data labels empowers you to effectively communicate your message. You ensure that your audience grasps the essential information with ease.
Take advantage of these techniques and unlock the full potential of your Excel graphs by confidently rotating data labels to optimize your data presentation.

![How to Make Negative Percentages in Parentheses in Excel [4 Methods]](http://cdn-63272552c1ac188968e9a570.closte.com/wp-content/uploads/2023/04/Negative-Percentages-in-Parentheses-768x432.jpg)

![How to Find Top 5 Values in Excel [9 Methods]](http://cdn-63272552c1ac188968e9a570.closte.com/wp-content/uploads/2023/03/Find-Top-5-Values-768x432.jpg)

![How to Do Antilog in Excel [6 Easy Ways]](http://cdn-63272552c1ac188968e9a570.closte.com/wp-content/uploads/2023/03/Calculate-Antilog-768x432.jpg)